A look at where the dollars are going
Educate your customers, dazzle your boss, by reciting recently released data from the Medicare Payment Advisory Commission (MedPAC), an independent agency established in 1997 to advise the U.S. Congress on issues affecting the Medicare program.
Total spending
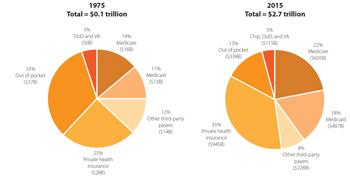
- Overall spending. In 2015, total national health care spending was $3.2 trillion, or 17.8 percent of GDP. Private health insurance spending was $1.1 trillion, or 5.9 percent of GDP. Medicare spending was $646.2 billion, or 3.6 percent of GDP.
- Spending accelerating. Healthcare spending growth shows signs of acceleration after several years of historic lows. From 1975 to 2009, total health care spending and Medicare spending grew at average annual rates of 9.0 percent and 10.6 percent, respectively. Then from 2009 to 2013, those rates fell to 3.6 percent and 4.1 percent. From 2013 to 2015, Medicare actuaries estimate that spending grew faster: National health care spending grew at an average annual rate of 5.6 percent, and Medicare spending grew 4.6 percent.
- Boom. The aging of the baby boomer generation will have a profound impact on both the Medicare program and the taxpayers who support it. Over the next 15 years, as Medicare enrollment surges, the number of tax-paying workers per beneficiary will decline. By 2030 (the year all boomers will have aged into Medicare), the Medicare Trustees project there will be just 2.4 workers for each Medicare beneficiary, down from 4.6 around the time of the program’s inception and 3.3 in 2012.
- Look out! By 2040, under federal tax and spending policies specified in current law, Medicare spending combined with spending on other major healthcare programs, Social Security, and net interest on the national debt will exceed total projected federal revenues and will thus either increase federal deficits and debt or crowd out spending on all other national priorities.
Hospital inpatient and outpatient services
In 2015, the Medicare fee-for-service program paid 4,700 hospitals $178 billion for about 10 million Medicare inpatient admissions, 200 million outpatient services, and $8 billion of non-Medicare uncompensated care costs. This sum represents a 3 percent increase in hospital spending from 2014 to 2015.
- On net, inpatient payments increased by $2 billion and outpatient payments increased by almost $4 billion. Inpatient payments increased because of slight increases in prices, patient severity and inpatient volume. Outpatient payments rose because of volume increases, price increases, and the continued shift of services from lower cost physician offices to higher cost hospital outpatient settings.
- The average hospital occupancy rate was 62 percent in 2015, suggesting that hospitals have excess inpatient capacity in most markets. Inpatient use per beneficiary increased by 0.4 percent in 2015, and use of outpatient services increased by 2.2 percent. The small increase in inpatient admissions per capita follows years of steady declines.
- Hospital mortality and readmission rates have improved in recent years.
- Patient satisfaction also has improved, with the share of patients rating their hospital a 9 or 10 on a 10-point scale increasing from 69 percent in 2011 to 72 percent in 2015.
Physician and other professional services
In 2015, Medicare paid $70.3 billion for physician and other health professional services, accounting for 15 percent of fee-for-service Medicare benefit spending.
- About 919,000 clinicians billed Medicare in 2015 – over 581,000 physicians and nearly 338,000 nurse practitioners, physician assistants, therapists, chiropractors, and other practitioners.
- Medicare payment rates for physician and other health professional services in 2015 were 78 percent of commercial rates for preferred provider organizations, the same as in 2014.
- Average annual physician compensation increased by 4 percent in 2015, although average compensation was much lower for primary care physicians than for physicians in specialty groups such as radiology and nonsurgical, procedural specialties.
Ambulatory surgery centers
In 2015, nearly 5,500 ambulatory surgery centers treated 3.4 million fee-for-service Medicare beneficiaries. Medicare program and beneficiary spending on ASC services was about $4.1 billion.
- The number of Medicare-certified ASCs grew from 2010 to 2014 at an average annual rate of 1.1 percent. In 2015, the number of ASCs increased 1.4 percent.
- Most new ASCs in 2015 (96 percent) were for-profit facilities.
- The volume of services per beneficiary grew from 2010 through 2014 by an average annual rate of 0.5 percent. In 2015, volume increased by 1.8 percent, which is higher than in recent years.
 Post-acute care
Post-acute-care providers include skilled nursing facilities (SNFs), home health agencies (HHAs), inpatient rehabilitation facilities (IRFs), and long-term care hospitals (LTCHs). In 2015, fee-for-service program spending on post-acute-care services totaled $60 billion.
- High levels of spending and the inequity of payments across different types of patients has led the Medicare Payment Advisory Commission to recommend changes to both the level and the designs of the payment systems.
- Given the similarity of some of the patients treated in the four PAC settings but substantial differences in the payments made by Medicare, in June 2016 the Commission recommended features of a unified payment system. Like the recommended designs of the HHA and SNF prospective payment system, the unified PAC prospective-payment system would base payments on patient characteristics.
- Transitioning to a PAC prospective payment system could begin as early as 2021; until then, MedPAC advises CMS to move forward with revisions to the SNF and HHA prospective payment systems. With consistent incentives, MedPAC believes the revised payment systems will give providers valuable experience in managing care under payment systems that tailor payments to the care needs of patients.
Skilled nursing facility services
SNFs provide short-term skilled nursing and rehabilitation services to beneficiaries after a stay in an acute care hospital. In 2015, about 15,000 SNFs furnished 2.4 million Medicare-covered stays to 1.7 million fee-for-service beneficiaries. Medicare fee-for-service spending on SNF services was $29.8 billion in 2015.
- Median occupancy between 2014 and 2015 declined slightly but remained high (86 percent), with one-quarter of SNFs having rates at or below 75 percent.
- Covered admissions per FFS beneficiary increased between 2014 and 2015, consistent with increases in inpatient hospital admissions. (A three-day inpatient stay is required for Medicare coverage of SNF services). At the same time, length of stay declined, resulting in a net reduction in covered days.
- The average Medicare margin was 12.6 percent in 2015 – the 16th year in a row that the average was above 10 percent. Margins continued to vary greatly across facilities, reflecting differences in costs and shortcomings in the SNF PPS, which favors treating rehabilitation patients over medically complex patients.
 Home health services
Home health agencies provide services to beneficiaries who are homebound and need skilled nursing or therapy. In 2015, about 3.5 million Medicare beneficiaries received care, and the program spent about $18.1 billion on home health care services. In that year, over 12,300 agencies participated in Medicare.
- The number of agencies fell slightly in 2015 by 0.9 percent after a long period of growth. (From 2004 to 2014, the number of agencies increased by 63 percent.) The decline in 2015 was concentrated in areas that experienced sharp increases in supply in prior years
- The volume of services in 2015 increased by 0.3 percent, reversing a three-year trend of modest decline.
- The total number of users increased slightly in 2015, while the average number of episodes per home health user declined by 0.6 percent.
- From 2002 to 2015, home health utilization increased substantially, with the number of episodes increasing by over 60 percent and the episodes per home health user increasing from 1.6 to 1.9 episodes.
- Episodes not preceded by a hospitalization accounted for most of the growth in home health utilization from 2002 to 2015; these episodes increased from about one-half to two-thirds of total episodes.
- For more than a decade, payments have consistently and substantially exceeded costs in the home health PPS. Medicare margins for freestanding agencies averaged 16.5 percent between 2001 and 2014 and were, on average, 15.6 percent in 2015. (The marginal profit for HHAs in 2015 was 18.1 percent.) MedPAC projects that Medicare margins for 2017 will equal 13.7 percent.
Outpatient dialysis services
Outpatient dialysis services are used to treat the majority of individuals with end-stage renal disease (ESRD). In 2015, nearly 388,000 beneficiaries with ESRD on dialysis were covered under FFS Medicare and received dialysis from nearly 6,500 dialysis facilities. Since 2011, Medicare has paid for outpatient dialysis services using a prospective payment system (PPS) based on a bundle of services. The bundle includes certain dialysis drugs and ESRD-related clinical laboratory tests that were previously paid separately.
- Medicare expenditures for outpatient dialysis services in 2015 were $11.2 billion, a slight decline of 0.1 percent compared with 2014 Medicare dialysis expenditures.
- The number of dialysis treatment stations grew slightly faster than the number of dialysis beneficiaries between 2014 and 2015.
- The number of fee-for-service dialysis beneficiaries grew by 1.0 percent between 2014 and 2015, while the total number of treatments grew by 0.4 percent.
- A potential concern is that the proportion of patients with higher levels of residual kidney function upon the initiation of dialysis increased from 13 percent in 1996 to 43 percent in 2010.
Hospice services
The Medicare hospice benefit covers palliative and support services for beneficiaries who are terminally ill with a life expectancy of six months or less if the illness runs its normal course. Beneficiaries may choose to elect the Medicare hospice benefit; in so doing, they agree to forgo Medicare coverage for conventional treatment of their terminal illness and related conditions.
- More than 1.38 million Medicare beneficiaries (including nearly 49 percent of decedents) received hospice services from about 4,200 providers in 2015.
- Medicare hospice expenditures totaled about $15.9 billion in 2015.
- The number of hospice providers increased by about 2.6 percent in 2015, due almost entirely to growth in the number of for-profit hospices, continuing a more than decade–long trend of substantial market entry by for-profit providers.
- The proportion of beneficiaries using hospice services at the end of life continued to grow in 2015, while average length of stay among decedents declined slightly.
- Average length of stay among decedents declined slightly between 2014 and 2015, from 88.2 days to 86.7 days, as a result of a decrease in length of stay among hospice decedents with the longest stays. The median length of stay for hospice decedents was 17 days in 2015 and has remained stable at approximately 17 or 18 days for more than a decade.
Source: Report to the Congress: Medicare Payment Policy, Medicare Payment Advisory Commission, http://www.medpac.gov/docs/default-source/reports/mar17_entirereport.pdf?sfvrsn=0